
Industrial Software in Production Practice: How Quality Manufacturing Corporation Pushes PolyWorks|DataLoop™ 3D Data to the Plant Floor
By Michael Torres, SmartManufacturing desk, WorldIndustrialWeekly
A dimensional result only earns its cost when it reaches the operator, the team lead and the customer faster than the part moves down line. That is the organizing idea behind the metrology architecture at Quality Manufacturing Corporation, where the inspection mix on the floor — first-piece, periodic and audit work captured with scanning arms — is analyzed in PolyWorks|Inspector™ and then published enterprise-wide through PolyWorks|DataLoop™. 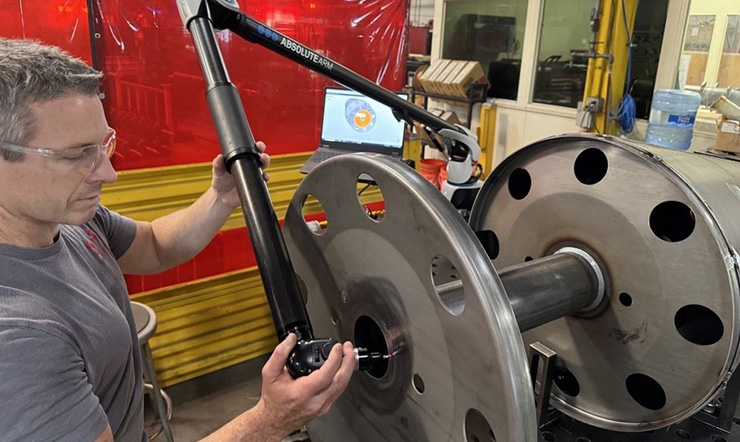 The interesting part for a smart-manufacturing reader is not the scan. It is the short distance the company has built between scan and decision.
A Fabricator Whose Quality System Has to Keep Pace With Continuous Operation
Quality Manufacturing Corporation operates as a fabricator whose service range runs from prototype conception through large-scale OEM production. It has been in business since 1995 and built its standing on high-quality components at competitive price points — an orientation the company traces to its small-business origins.
From its Urbandale, Iowa headquarters the organization staffs around 500 people, serving agriculture and construction customers in the main while widening its presence in the industrial market. Nothing about the calendar softens the demand: operations run 24/7, and product quality is treated as a constant across shifts rather than an end-of-week review.
For new parts, quality and inspection specialists on the production floor apply Advanced Product Quality Planning (APQP), a sequence that evaluates manufacturing capabilities, identifies and manages potential risks, and keeps control over critical product features. In digital-thread terms, APQP is where traceability is designed in — the features that later appear on a dashboard are decided long before a measurement file exists.
The Binding Constraint Moved From Measurement to Communication
Metrology sits at the center of the plant's quality process, inside a flow shaped by a steady stream of new projects plus first article, in-process and audit inspections. The bottleneck was not the accuracy of the measurement but the delivery of its meaning to shop floor operators, team leads and customers.
“Simply presenting raw numbers was no longer sufficient. We recognized the need to deliver more meaningful, visual reporting that incorporated images, trend analysis, and deeper data insights. This approach allows us to better identify root causes and address issues proactively, before they escalate into larger, more costly problems,” indicates Zach Kapfer, Quality Engineering Manager.
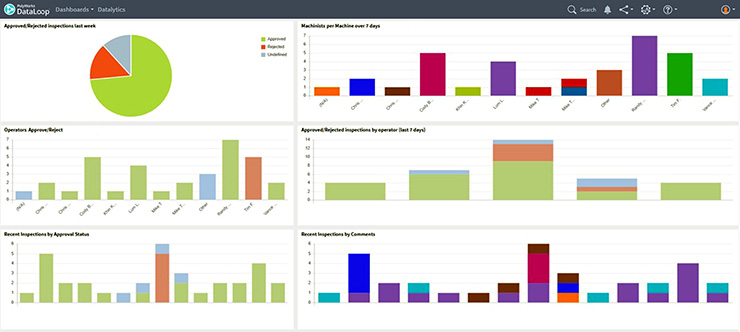 A report configured by the quality team and rendered in PolyWorks|DataLoop™ turns a dimensional result into a color-coded status any position on the line can interpret.
Kapfer brings 13 years with the organization to the role and leads 20 quality engineers and inspectors. “My role covers a wide range of products and keeps me actively involved across all areas of the floor; solving problems as they arise, putting preventive measures in place, and working with teams to complete corrective actions,” he explains.
Dimensional analysis has been executed with PolyWorks|Inspector since 2013, driven by FARO Quantum Max and Hexagon ROMER portable arms. Because work is distributed across several buildings, keeping measurement practice consistent between production areas became a standing requirement. To standardize processes and further streamline operations, the company selected PolyWorks|DataLoop as its 3D data management solution in 2023.
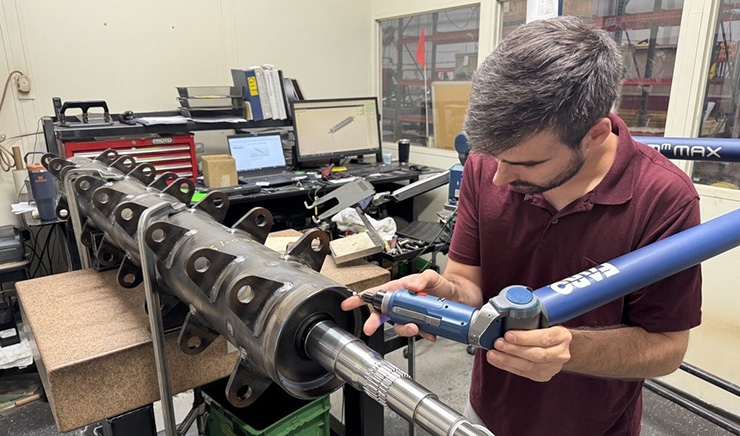 The inspection toolchain in place since 2013, with the 3D data sharing layer added in 2023 — the pairing that produced the productivity gains described below.
On the two halves of that stack, Kapfer is specific: “InnovMetric demonstrated a shared commitment to enhanced reporting through PolyWorks ® , while also providing easier, more efficient access to critical data via PolyWorks|DataLoop.”
Implementation Sequence: The Route From Arm to Dashboard
- Anchor the measurement first. Every inspection stream is captured with portable arms and analyzed in one tool, which at this plant has been PolyWorks|Inspector since 2013.
- Name the variability explicitly. With production spread over several buildings, differences in practice between areas were treated as a defect to remove rather than an inconvenience to absorb.
- Add a data layer, not a shared folder. In 2023 the organization adopted PolyWorks|DataLoop so measurement results travel as managed 3D data instead of attachments.
- Configure dashboards per production area. Each area received its own pre-set view carrying targets and performance metrics rather than a single generic report.
- Make the readout unambiguous for non-specialists. Color status and SPC charts let operators interpret results without software training.
- Cut retrieval cost in daily work. Fast search and load of programs is where the day-to-day difference is felt by the quality team.
- Extend visibility outward. Authorized users, including customers, read the same evidence, which supports early-stage onboarding conversations.
Effects on Cycle Time, Consistency and Readability
Throughput and repeatability
“One of the most significant benefits has been a measurable reduction in turnaround time,” Kapfer says. His account of how that was achieved is procedural rather than incidental: “By leveraging PolyWorks|DataLoop, we have been able to streamline our inspection workflows. The results are greater consistency among all our quality engineers and a notable decrease in overall inspection time. Standardizing our processes not only improves throughput but also ensures our inspection results are reliable and repeatable, regardless of who performs the work. With tight schedules and high expectations, consistency is key.”
Harmonizing methods across teams lowers result variability while shortening cycles at the same time — the combination that matters in a high-demand environment where speed and accuracy are simultaneous requirements.
| Operating dimension | Before the 3D data layer | After PolyWorks|DataLoop in production use |
|---|---|---|
| Reporting unit | Raw numbers presented to a narrow audience | Images, trend analysis and deeper data insights in shared views |
| Cross-building consistency | Measurement practice varied between production areas | Inspection methods standardized across teams |
| Turnaround | Longer inspection-to-report cycle | Measurable reduction in turnaround time |
| Floor readability | Interpretation depended on metrology expertise | Red-green cue readable by operators, team leads and customers |
| Program retrieval | Slower loading of inspection programs | Rapid search and load as a daily efficiency gain |
| Adoption effort | Onboarding time a barrier to spread | Minimal onboarding on the web interface |
Communication as the daily operating rhythm
Dashboard work changed how information is interpreted inside the plant. “We have developed customized, pre-set dashboards for each of our production areas, providing a clear and immediate visual representation of our targets and performance metrics,” indicates Kapfer.
The simplification is deliberate. “Being able to have this very simple red-green visual cue has been huge! You don’t really need to know anything about the software to understand that green is good and red is bad. It just helps bridge the communication between everybody,” he adds.
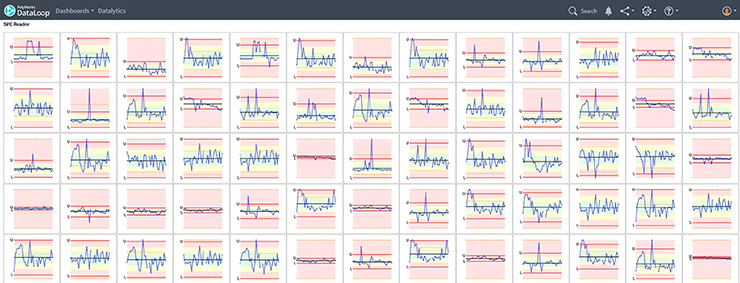 SPC charts displayed in PolyWorks|DataLoop keep inspection status visible to operators during the run instead of after the report is issued.
That visibility lets teams track quality performance in real time and align on priorities quickly, with authorized users reaching reports easily — a direct improvement in responsiveness and collaboration. “The ability to quickly search for and load programs has been a notable efficiency gain in our day-to-day activities,” Kapfer states.
Adoption speed is a software question as much as a data question. Of the PolyWorks|DataLoop Web Interface, Kapfer explains: “It is highly intuitive and easy to navigate, requiring minimal onboarding time for our team.”
Support as part of the architecture
Kapfer frames the vendor relationship as a capability, not a warranty line: “The team there has been incredibly helpful. They have been extremely responsive and beneficial, not only in addressing my own inquiries, but in supporting other team members as well. Their ability to quickly resolve questions and provide clear guidance has been invaluable. We see them as a great partner.”
That posture determines how much installed capability is actually used. With InnovMetric answering quickly, the quality team works more of the system's functions, clears blockers without stalling the schedule, and holds productivity at the level the dashboards promise.
Common Pitfalls This Deployment Flags for Digital Quality Projects
- Handing the line a table of numbers and calling it reporting. Visual context, trend and insight are what convert a measurement into a corrective action.
- Letting multi-building operation quietly become multi-method operation. Consistency has to be engineered into the workflow, not hoped for across shifts.
- Sharing files instead of managing 3D data. Attachments fragment; a data layer standardizes.
- Designing dashboards only a metrology engineer can read. If operators need software knowledge to interpret status, the loop stays closed.
- Ignoring retrieval friction. Search and load speed inside a program library is an adoption variable, not a convenience.
- Treating interface onboarding as a training afterthought.
- Keeping customer-facing visibility inside the sales cycle rather than the quality system.
Selection Checklist: Connecting Inspection Systems to Production Visibility
- Does the analysis layer support the portable arms already on the floor and the inspection types in use — first-piece, periodic, audit?
- Is the new-part workflow linked to APQP so critical features are defined before measurement programs are built?
- Can dashboards be pre-set per production area, carrying that area's targets and metrics?
- Are SPC charts and simple color status available to operators, not only to engineers?
- Is there a searchable program library with fast load?
- Does role-based access let authorized users, including customers, reach the same evidence?
- Is there a mechanism that keeps measurement practice consistent across buildings and shifts?
- Does the web interface require minimal onboarding time?
- Is vendor technical support responsive enough to keep the team unblocked?
Where Measurement Credibility Becomes Competitive Ground
Integrating the 3D data layer into the metrology process has strengthened the company's position with buyers. “Our customers have come to trust and rely on the accuracy of our measurement data, knowing that we are committed to delivering the most precise and reliable information available,” highlights Kapfer.
That trust compounds. “This level of confidence in our capabilities strengthens existing customer relationships and provides a solid foundation for long-term partnerships. Additionally, our technology investments have proven to be valuable assets in the onboarding of new customers,” he adds — an argument that reframes quality software as commercial infrastructure.
“Being able to showcase our capabilities early in customer relationships sets a strong precedent for the quality and transparency they can expect from us. As we look to the future, we believe these investments will continue to differentiate Quality Manufacturing Corporation in the industry and support our ongoing growth,” Kapfer concludes.
FAQ
What role does PolyWorks|DataLoop™ play in this plant?
It is the 3D data management layer adopted in 2023 that carries measurement results from the quality team to operators, team leads and customers, standardizing inspection practice across production areas in a multi-building operation.
Which hardware and software produce the data being shared?
Dimensional analysis has run on PolyWorks|Inspector since 2013 using FARO Quantum Max and Hexagon ROMER portable arms, covering first-piece, periodic and audit inspections. New parts are qualified through APQP.
What changed first, speed or consistency?
Both moved together. Kapfer points to a measurable reduction in turnaround time and to greater consistency among all quality engineers, with results reliable and repeatable regardless of who performs the work.
Who is allowed to see the dashboards?
Authorized users across the organization and customers access the reports; each production area works from its own pre-set dashboard with targets and performance metrics.
How hard was adoption for the workforce?
The team that consumes the data includes shop-floor operators with no metrology software background, which is why the red-green cue matters. On the PolyWorks|DataLoop Web Interface, Kapfer reports minimal onboarding time for the team of 20 quality engineers and inspectors.
Action Advice for Manufacturing Leaders
- Audit the handoff, not only the hardware: ask what an operator can decide from an inspection report without asking a quality engineer.
- Define cross-area measurement practice as a single standard before adding more sites or lines.
- Pilot one production-area dashboard with targets, color status and SPC charts, then measure turnaround before and after.
- Make program search and load time an acceptance criterion in any industrial software selection.
- Extend authorized visibility to customers deliberately and use the demonstration early in onboarding.
- Test the vendor's response time during evaluation, since support capacity is part of the deployed architecture.
For readers planning a quality-data rollout, the transferable pattern here is a narrow one: keep one analysis standard at the machine, put a managed data layer above it, and let the plant floor read the result without translation. WorldIndustrialWeekly's SmartManufacturing desk covers shop-floor data, industrial software and production-line transformation; editorial contact: news@industrialweekly.com (Industrial Weekly).