
A Practical Playbook After the October ISM Print: Turning a 55.5% PMI Into Plant, Procurement and Capex Decisions
When a monthly diffusion index lands, operations teams rarely read it as a headline. They read it as three problems arriving at once: how much output to commit, how much material to buy, and how much cost to absorb before the next customer quote is signed. October's survey from the Institute for Supply Management made that translation unusually concrete. The ISM PMI printed 55.5%, up 1.0 percentage point from September's 54.5%, which means U.S. manufacturing activity expanded for the 10th consecutive month. Susan Spence, chair of the ISM Manufacturing Business Survey Committee, compressed the month into one line: "In October, U.S. manufacturing activity remained in expansion territory."
What follows is the working version of that report — what each subindex obliges a planner to do, where the data is easy to misread, and the contract clauses, sourcing splits and hiring windows that convert an expansionary print into a defensible operating plan.
Step 1: Fix the baseline before reacting to any single line
Streaks are the variable most often skipped in a monthly print. October marks 10 straight months of industrial expansion after a 10-month contraction, and the same survey indicates the overall U.S. economy grew for a 24th consecutive month. The committee's economic modeling also hands planners a macro anchor they can quote internally: an October reading of 55.5% corresponds to a 2.7% annualized increase in real gross domestic product.
The internals, however, are not moving in one direction. Spence's breakdown is the sentence an operations review should open with: "Of the five subindexes that make up the PMI, four (New Orders, Production, Supplier Deliveries, and Inventories) grew faster than the previous month, while employment growth slowed down by 0.3 percentage points."
A mechanical caution belongs here because it explains most of the argument this data provokes. The PMI is an equal-weighted composite of those five diffusion indexes — New Orders, Production, Employment, Supplier Deliveries and Inventories — as ISM's own methodology note states (ismworld.org). A sharp step up in output can therefore sit on top of a softening labor line and still produce a higher headline. Treat the composite as a portfolio signal; treat the subindexes as work orders.
 Susan Spence (Source: ISM)
Step 2: Read the output-order spread — capacity, not demand, is binding
Factory output data is the strongest single argument that plants, not markets, are the current constraint. The Production Index climbed 2.3 percentage points to 59.0% in October from 56.7% in September, the index's highest reading since November 2021 (60.5%) and its 12th consecutive month of expansion.
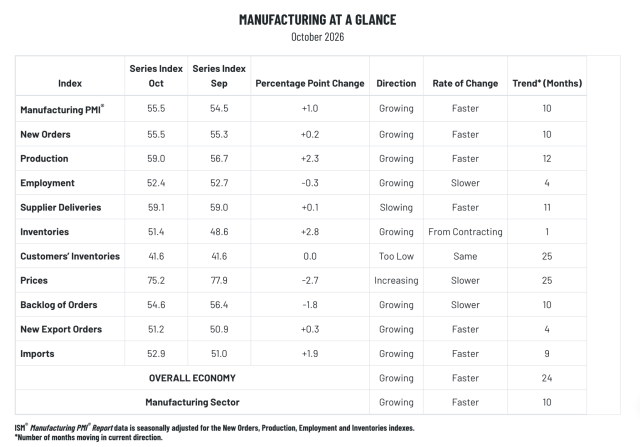 (Source: Institute for Supply Management)
Demand held without stretching. The New Orders Index reached 55.5%, up 0.2 percentage points from September's 55.3%. The more informative pairing is the Backlog of Orders Index at 54.6%, down 1.8 percentage points from 56.4%: still expansionary for a 10th straight month, but easing while the factory runs harder. That combination — backlog shrinking, output accelerating — is the signature of a capacity-limited book, not a collapsing one, and the response differs accordingly: add shifts and protect price rather than chase orders.
Delivery performance says the same thing from the supply side. The Supplier Deliveries Index registered 59.1%, up 0.1 percentage point from September's 59.0%, pointing to slower delivery performance for the 11th consecutive month, with Five of the six largest manufacturing industries reporting slower deliveries.
| Subindex | October | September | Planning signal |
|---|---|---|---|
| New Orders | 55.5% | 55.3% | Commitment risk is low; keep quotation validity short |
| Production | 59.0% | 56.7% | Shift coverage, maintenance windows and test capacity are the bottleneck |
| Backlog of Orders | 54.6% | 56.4% | Easing backlog plus rising output equals constrained capacity, not weak demand |
| Supplier Deliveries | 59.1% | 59.0% | Extend the planning horizon; index price to published metal and resin quotes |
| Employment | 52.4% | 52.7% | The hiring window is still open, but narrowing |
| Inventories | 51.4% | 48.6% | Buffer rebuilding starts now, on your terms rather than under shortage |
| Prices | 75.2% | 77.9% | Re-price contracts; do not simply re-forecast the year |
| Sector GDP in contraction | 6% | 2% | Segment customers by their own industry's exposure, not the national average |
Step 3: Split the book into the AI-linked half and the everything-else half
Panel responses in the October report describe two economies inside a single plant. High-tech and defense suppliers reported demand they cannot absorb. An executive in the machinery sector stated: "Explosive growth in the semiconductor and government/defense spaces has put us on our heels as we try to work through demand." That same executive supplied the numbers an operations team should plan with: "The long-awaited wave has arrived for our company, and it seems the global supply chain is in similar straits. Lead times and prices are rising, and some carry Covid-19 era delays—four weeks is now 50 weeks; a $2,000 item six months ago is now $4,000. We are hand-to-mouth. All the while, our customers are breaking down the doors complaining about our delivery delays."
A jump from four weeks to 50 weeks is not a scheduling tweak. It invalidates any materials planning horizon shorter than a year and any quotation valid for longer than a quarter, and it converts expediting from a tactic into a standing budget line. A second respondent described the input side bluntly: "New month, same trends: Any commodity consumed by AI/data centers is in a crunch, both for supply and pricing."
Independently, the electrical-equipment tail is now measured in years. Wood Mackenzie data cited by the Cybersecurity and Infrastructure Security Agency's National Infrastructure Advisory Council in its grid-transformer shortage report places large substation power and generator step-up transformer lead times at 80 to 210 weeks. Anyone buying or building switchgear, cable assemblies, drives or rotating machinery should assume the long pole in the bill of materials sits outside the metal complex entirely.
The non-AI half of the book is behaving differently. A computer and electronic products executive observed that "global demand for capital scientific instrumentation assets has slowed due to continued uncertainty in the Middle East, Eastern Europe, and China." The executive added: "anticipation over the mid-term elections and impact to funding for scientific research and the National Institutes of Health also is impacting customers’ purchasing behavior, making them focus on optimizing existing technology and tools."
Aggregates confirm the split rather than averaging it away: twelve manufacturing industries reported growth in October while three reported contraction, according to the ISM release distributed through PR Newswire (prnewswire.com), with Electrical Equipment, Machinery and Computer & Electronic Products among the expanding group. A single national average hides both halves of that picture.
Step 4: Put cost mechanics into contracts, not into forecasts
Price pressure loosened at the margin and remained punishing. The Prices Index registered 75.2%, down 2.7 percentage points from September's 77.9%. Despite the decline, the index indicates that raw material prices increased for a 25th consecutive month, with 53.1% of respondents reporting higher prices compared to 58.6% in September, and Five of the six largest manufacturing sectors reported paying higher input prices.
Spence's three-driver breakdown is worth putting in front of a supplier during negotiation because each driver is independently observable: "The Prices Index reading is still being driven by (1) increases in steel and aluminum prices that impact the entire value chain, (2) tariffs applied to many imported goods, and (3) increases in petroleum-based products as a result of the Middle East conflict."
A chemical products executive shows how granular the exposure becomes: costs are up more than 6% across the tracked basket, and "of the tracked items, only nine are lower, 24 are higher, and six are neutral." A basket with that shape argues against negotiating at the aggregate level; the workable method is item-by-item review, with a published-index escalator on the volatile lines and flat pricing negotiated on the nine that came down.
The tariff mechanics that planners still get wrong
Duty exposure is a customs-classification question before it is a purchasing question. Section 232 tariffs on imported steel and aluminum moved from 25 percent to 50 percent effective 12:01 a.m. EDT on June 4, 2025, under the White House proclamation adjusting metal imports (whitehouse.gov), and trade advisers note that the flat 50 percent applies to the full value of articles made entirely or almost entirely of steel or aluminum — not only to the metal content share. A further 407 derivative products were added to the 50 percent list effective August 18, 2025.
Run the bill of materials against the derivative annex, test whether a semi-finished assembly now enters as "almost entirely" metal, confirm origin and de minimis treatment with your broker, and re-read any supplier clause written when the surcharge was assumed temporary.
Respondents in the metal chain said the planning damage is broader than the duty itself. A respondent from the primary metals sector pointed out: "Material shortages abound. Fuel remains high. Uncertainty remains constant." The respondent added: "Canadian tariffs continue to have a negative impact on steel." An executive in fabricated metal products concurred, stating that "economic policies coming out of Washington continue to weigh on business conditions and Canadian tariffs continue to damage small U.S. businesses selling into that important market."
Step 5: Open the hiring and buffer windows while they remain open
Industrial employers kept adding heads, only slightly less quickly. The ISM Employment Index registered 52.4%, down 0.3 percentage points from September's 52.7%, so employment growth continued for a fourth consecutive month. This marked the fourth month of payroll expansion, and survey respondents favored hiring over headcount management by a 1.8-to-1 ratio. Eight manufacturing industries reported expanding employment, with four of the big six sectors — Machinery, Transportation Equipment, Computer & Electronic Products, and Food, Beverage & Tobacco Products — posting hiring gains.
The Inventories Index jumped 2.8 percentage points to 51.4%, up from 48.6% in September, moving raw materials inventories at manufacturing facilities back into expansion territory after September contraction. Seven industries expanded inventories in October, led by printing, plastics, textiles, and three of the big six sectors (Food, Beverage & Tobacco Products, Transportation Equipment, and Machinery).
Two buffers remain under a manufacturer's own control when supplier deliveries do not: labor and inventory. On inventory, the practical rule is to size a buffer from variability rather than from the promised date — safety stock roughly equals average daily consumption multiplied by the number of days the worst observed lead time exceeds the quoted one. On sourcing, dual sourcing only earns its cost when the alternate is genuinely live: qualified prints, running process capability, and a share of volume large enough to keep the second plant certified. Practitioner playbooks commonly cap a single supplier near 70 percent on A-class materials for that reason (business.amazon.com).
Step 6: Manage the tail of the curve, not the average
An expansionary headline can still conceal shrinking customers. ISM reported that 6% of manufacturing GDP contracted in October, up from 2% in September. Furthermore, the share of sector GDP in strong contraction, defined as a composite PMI of 45% or lower, rose to 6%, up from 2% in September. Spence noted that the share of sector GDP at or below 45% serves as "a good metric to gauge overall manufacturing weakness."
Turn that into a credit and capacity decision rather than a commentary: tag every account by its own industry composite, and where a customer sits in the contracting tail, shorten payment terms, convert blanket orders to firm releases, and pull forward obsolescence review on parts bought specifically for that account.
Four misreads this month's data invites
- Taking an easing backlog against accelerating output as the first sign of weak demand. With production at a multi-year high and deliveries slowing, the constraint is throughput.
- Reading the 2.7-point fall in the Prices Index as normalization. Raw material prices have now risen for 25 consecutive months, and the drivers Spence lists — metals, tariffs, petroleum — are policy- and conflict-linked, not cyclical.
- Treating tariff surcharges as a procurement problem alone. Scope, derivative lists and valuation rules decide the bill, and those are classification decisions.
- Freezing headcount because the Employment Index decelerated by 0.3 percentage points. At 52.4% the line is still expanding, and respondents still favor hiring over headcount reduction.
A 30/60/90-day plan for the next planning cycle
First 30 days
- Re-baseline quotation validity: cap fixed-price offers at one quarter wherever a metal, resin or electrical component appears in the bill of materials.
- Pull your own Supplier Deliveries equivalent — measured receipt date versus promised date by commodity — and compare it with the 59.1% index before escalating with vendors.
- Map which of your product families sit in the twelve expanding industries and which sit in the contracting three.
Days 31 to 60
- Move the highest-variance commodities onto published-index escalators with defined reset windows instead of ad hoc surcharges.
- Audit Section 232 derivative exposure line by line, including assemblies billed as fabricated products.
- Recompute safety stock from observed lead-time dispersion, starting with the items quoted in the machinery respondent's four weeks to 50 weeks range.
Days 61 to 90
- Qualify a live second source on A-class materials before the next capacity crunch, keeping meaningful volume with both parties.
- Convert capacity planning to a rolling four-quarter view where transformer, switchgear or semiconductor-linked components gate shipment dates.
- Review credit exposure for customers in the 6% of manufacturing GDP that contracted, and reset terms accordingly.
Frequently asked questions
Is a 55.5% PMI strong by historical standards?
Readings in the mid-50s are consistent expansion rather than a boom; the more useful context this month is the direction — up 1.0 percentage point, following a 10-month contraction that ended a full year ago. Strength now varies sharply by industry, which is why the sector-level figures matter more than the headline.
Which subindex should a plant manager watch most closely?
For the next two quarters, Supplier Deliveries and Backlog of Orders together. Deliveries have slowed for 11 consecutive months, and backlog is still expanding while easing — a pattern that shows how much of the growth is being consumed by throughput rather than by new demand.
Should we build raw material inventory now?
Targeted, yes; blanket, no. Inventories moved back into expansion at 51.4%, and the price deceleration of 2.7 percentage points reduces the penalty for holding. Build where lead-time dispersion is widest — the AI- and data-center-linked commodities flagged by survey respondents — and leave slow-moving, non-critical items on single-source replenishment.
What does the report imply for capital equipment purchases?
Expect a two-speed market. Semiconductor, data-center and defense-linked equipment queues are lengthening, while capital scientific instrumentation buyers are delaying as funding and geopolitical uncertainty in the Middle East, Eastern Europe, and China reshape their priorities. If your purchase depends on research or grant funding, build the mid-term election and National Institutes of Health budget cycle into your own delivery assumptions.
Does the employment slowdown signal a hiring freeze ahead?
Not yet. Employment growth continued for a fourth consecutive month at 52.4%, and eight industries added headcount. The deceleration is a reminder that labor plans, like price plans, should be revised quarterly against the survey rather than annually against a budget.
For industrial readers, the value of this print is not that factories grew; it is that growth arrived unevenly, concentrated in semiconductor, defense and AI-infrastructure channels while science-instrumentation and export-sensitive buyers hold back. Plants that respond with throughput plans, indexed contracts and live second sources can bank the expansion; those that manage to the headline will discover the cost pass-through in the next quarter. WorldIndustrialWeekly's industrial desk will continue tracking each monthly ISM release with the same operating lens. Readers with plant-level data on lead times, surcharges or tariff classification are invited to write news@industrialweekly.com.
By Michael Torres, WorldIndustrialWeekly / Industrial Weekly.