
Gas Sets the Price: Why nearly 90% of the UK Household Bill Rise Since 2020 Is a Wholesale Story, Not a Net-Zero One
By Michael Torres — WorldIndustrialWeekly, General desk
Every kilowatt-hour a British factory draws at seven on a cold evening is priced long before it reaches the meter: in the North Sea, at an LNG berth, inside the merit-order stack that the system operator has to ignite when demand peaks. Analysis carried out by thinktank Nesta and shared with Carbon Brief traces nearly 90% of the growth recorded since 2020 in UK household electricity bills to that chain — gas priced far above its pre-crisis norm. Read from an operations desk rather than a consumer-affairs page, the work is valuable for a different reason. It separates the volatile part of an energy invoice from the regulated part, and from the part a site can actually change.
1. One fuel writes the clearing price for everybody
Britain's exposure is structural on both sides of the meter. "Rising gas prices, not net-zero, have driven most of the recent surge in Britain's energy bills. Britain is particularly exposed, with over 80% of households connected to gas mains, while our electricity system still relies too much on gas as the marginal unit," Andrew Sissons, director for sustainable future at Nesta, tells Carbon Brief.
That last clause is the one industry should sit with. When a gas turbine sets the clearing price, every unit of power sold in that hour — including wind that cost next to nothing to generate — is paid at the gas level. Gas boilers in millions of buildings concentrate heat demand into the same cold hours, lengthening the stretch during which that turbine is the last unit called.
The pattern is not new. Carbon Brief reported in January 2026 that, even before the 2022 global energy crisis, two-thirds of the rise in electricity bills had been driven by high gas prices. Since then wholesale gas has returned to territory last seen before Russia's 2022 invasion of Ukraine, with the Middle East conflict keeping a war premium in the curve. As of 19 October, UK wholesale gas stood at 220p per therm (£75 per megawatt hour, MWh) — above the 2022 average of 210p/therm (£72/MWh).
Approval by the UK government for development of the Jackdaw gas field in the North Sea shows how thin the policy lever is: ministers themselves stated the project "would not…affect prices".
2. Splitting the £180: what moved on the electricity line
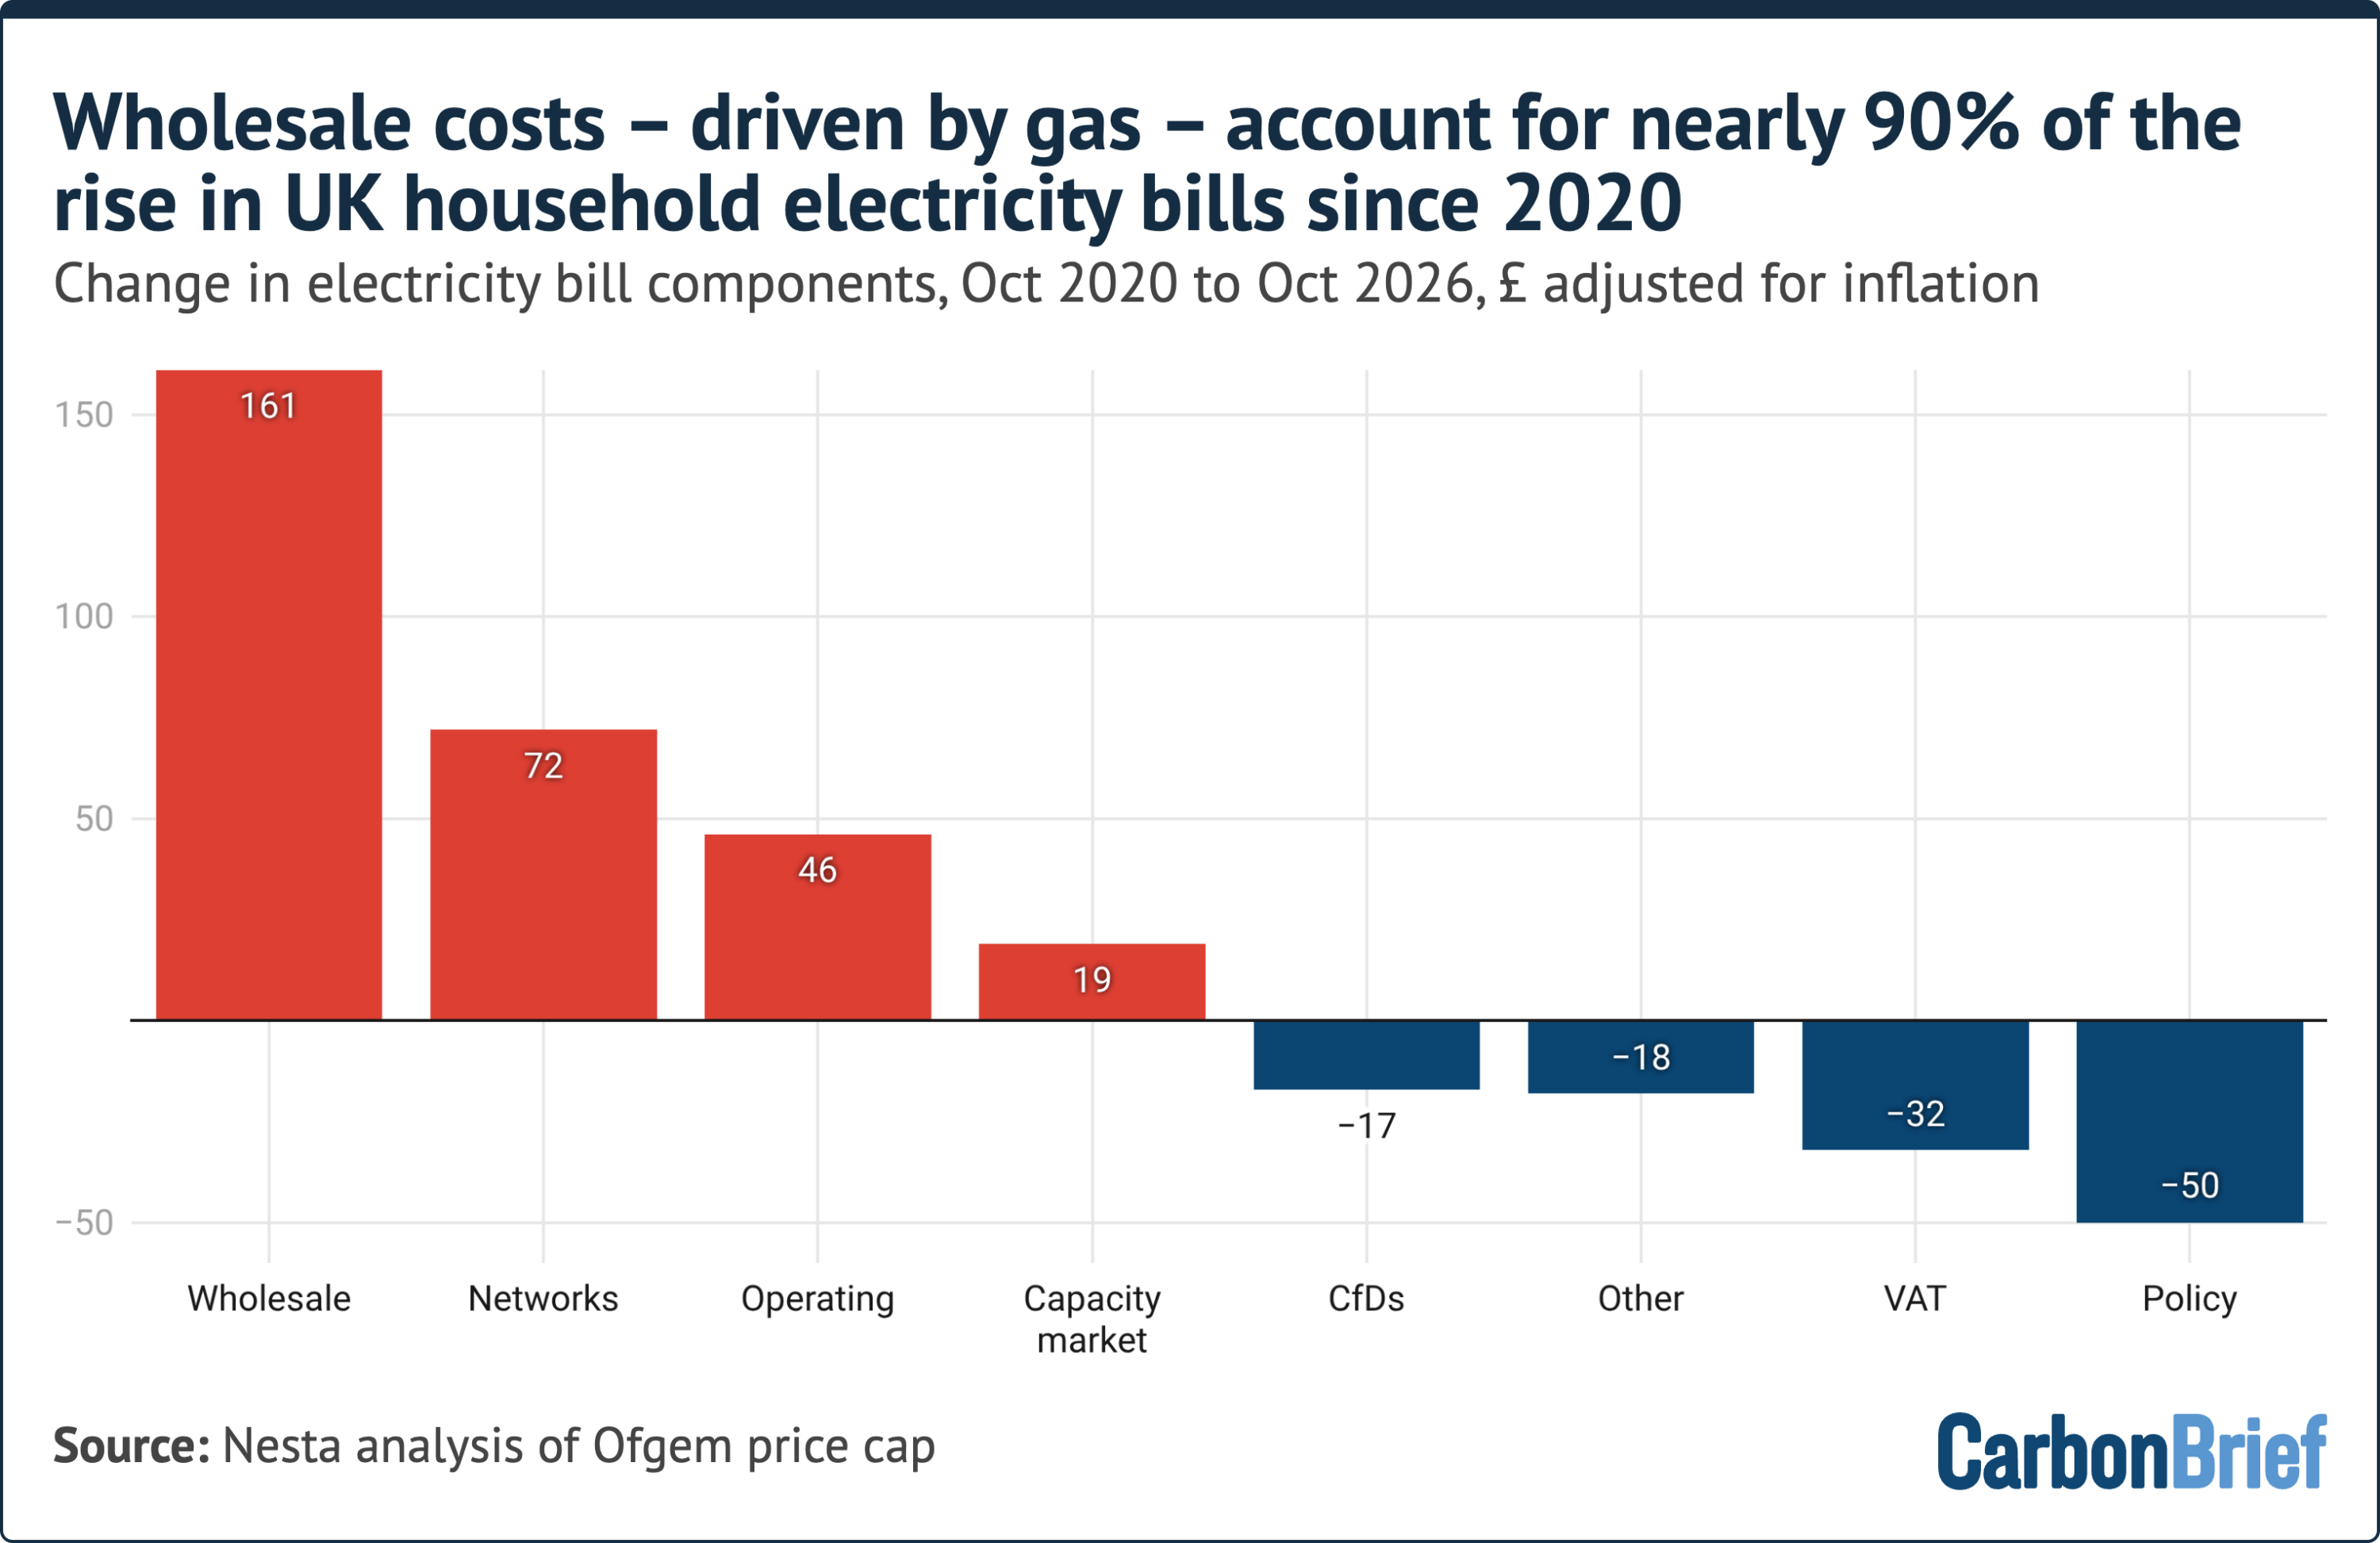
Stripped of inflation, a typical annual household electricity bill was £180 higher by the fourth quarter of 2026 than in the same period of 2020. Wholesale costs, driven by the price of gas, explain 90% of that gap — £161 of the total.
| Line item (electricity, real terms, 2020 → fourth quarter of 2026) | Movement | What it actually is |
|---|---|---|
| Wholesale, gas-driven | £161 | 90% of the £180 increase |
| Network | +£72 | £46 into transmission, the "motorways" of the grid; £21 into balancing |
| Supplier operating costs | +£46 | Linked to rising household energy debt; underlying Ofgem data does not itemise it |
| Renewable support (CfD) | −£17 | Net bill-reducing under the current price cap |
| Legacy policy costs | Falling | 75% of legacy renewable support moved to general taxation; "ECO" ended; VAT temporarily removed |
Two reference points keep the argument honest. Balancing the system in total — including "constraint payments" for turning off windfarms and turning on gas plants because grid capacity is insufficient — accounts for £35, or 4% of a typical £858 annual household electricity bill, even though wind constraint payments attract heavy news coverage. And supplier profit is not the villain of the piece: it is capped at 2.5% of bills.
3. Dual fuel: £444 of the swing is still gas
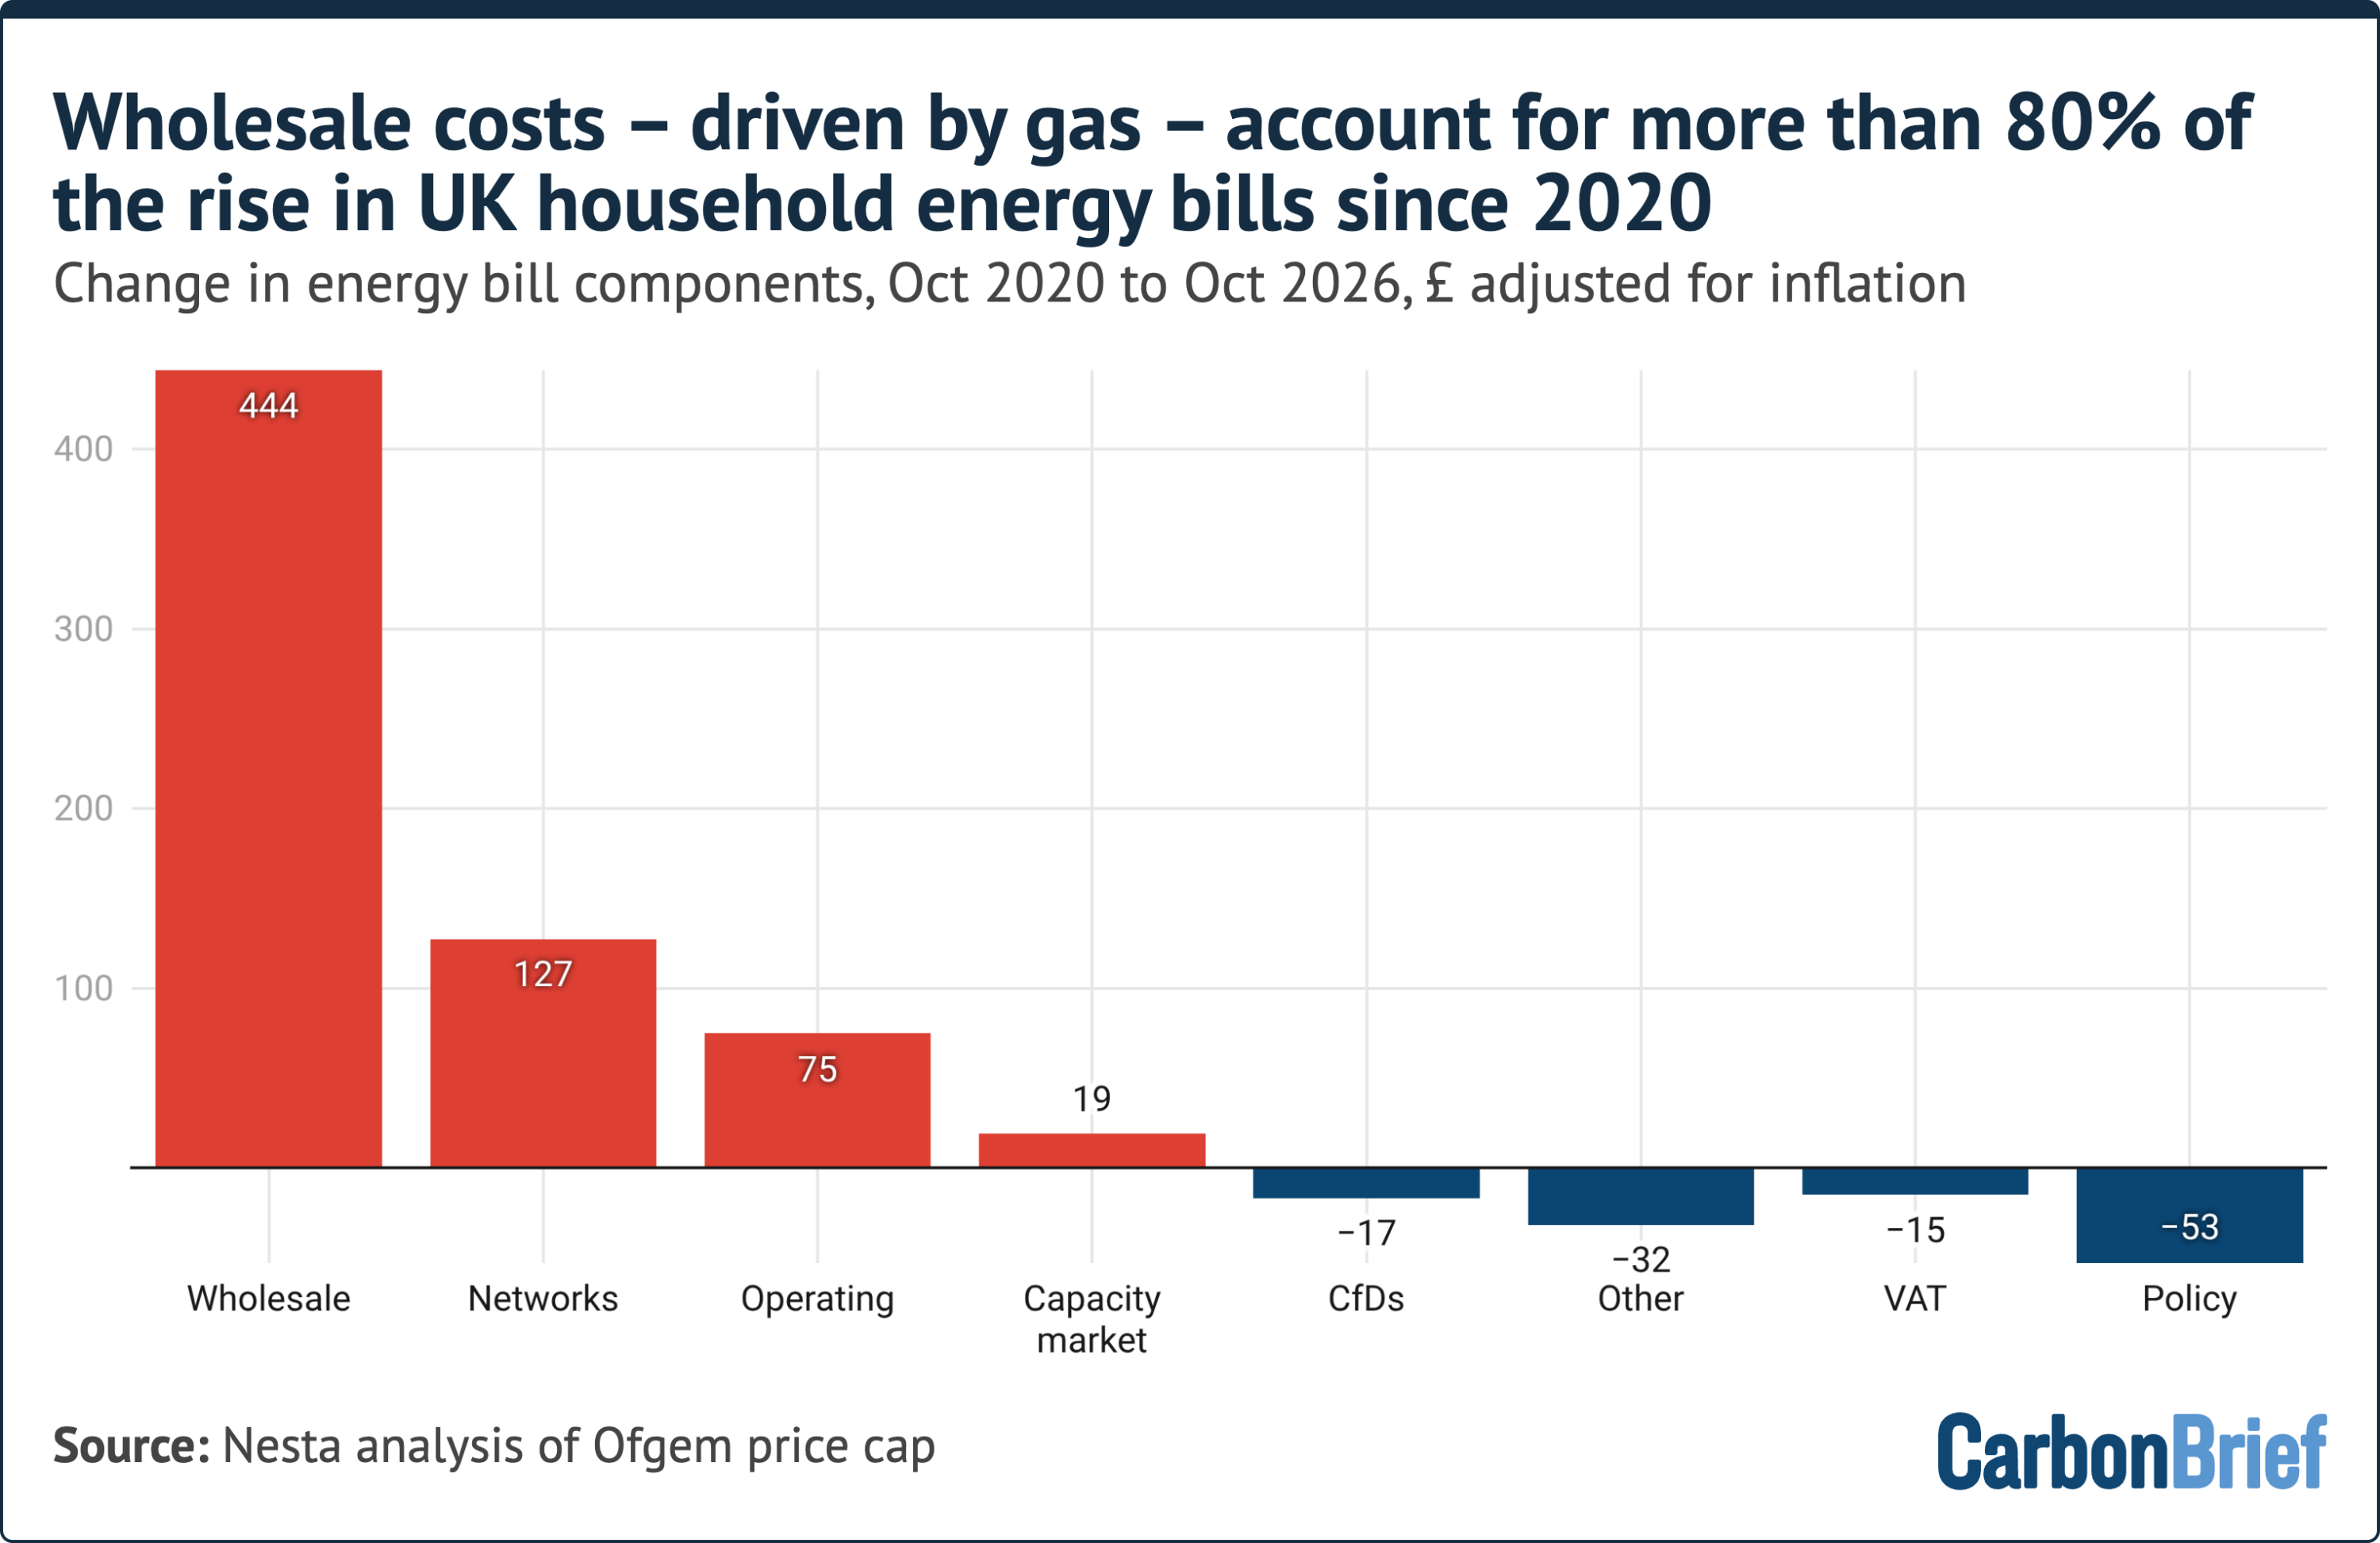
Household gas bills have increased £368 in real terms since 2020, and 77% of that rise — £283 — is due to wholesale gas costs.
Combined, total dual-fuel bills for a typical household moved from £1,175 per year in October 2020 to £1,723 per year in October 2026, a rise of 47%. Of that, £444 — 81% — comes from wholesale costs driven by high gas prices.
| Component of typical dual-fuel bills | October 2020 | October 2026 cap |
|---|---|---|
| Total bill (real terms) | £1,175 | £1,723 (+47%) |
| Government social and climate policy costs | £183 (16%) | £114 (7%) |
| Wholesale | £757 (44%) of the current cap — largest single component | |
| Network | £417 (24%) — second-largest component | |
| Operating costs | £291 (17%) | |
The £127 real-terms rise in network costs is split £72 for electricity transmission, distribution and balancing plus £55 for investment in the gas grid. The Energy Networks Association says up to 80% of investment in electricity grids is required to maintain existing assets, with the remainder going towards expansion for net-zero — a reminder that most of the network bill is about keeping the lights on, not about building new scenery.
4. A decoupling that is real but unfinished
Household electricity prices have increased far less rapidly than gas bills since the Hormuz crisis, with higher clean-energy generation helping break the link between the two.
"Upgrading the grid is not cost-neutral, but that price tag is dwarfed by the impact of rising gas prices. In fact, net-zero is helping to shelter Britain from the impact of expensive gas. Since the start of the Iran war, electricity bills have begun to decouple from gas bills, thanks to the UK’s increased renewable power and support from contracts for difference," Sissons says.
His prescription runs through demand: "Going further will require British households to have clean electricity, electric vehicles and heat pumps over fossil-fuel cars and boilers. By focusing on growing electricity demand, the government can spread upgrade costs more widely. This can lock in the consistent investment in electrification that is Britain's best path to stop global turmoil showing up on winter energy bills."
The same logic transfers to the shop floor. Electifying a process — industrial heat pumps, electric boilers, induction furnaces, fleet charging — adds load that dilutes fixed network cost per unit, but it also multiplies exposure to gas-set hours unless it is paired with contracted supply, storage and load flexibility.
5. Common misconceptions, corrected against the data
- "Green levies are what pushed bills up." Policy costs moved the other way, from £183 (16%) of typical dual-fuel bills in October 2020 to £114 (7%) now, with 75% of legacy renewable support shifted onto general taxation.
- "Paying windfarms to switch off is the hidden cost." Balancing is £35 in total, 4% of a £858 bill; only £21 of the £72 network increase relates to balancing.
- "Contracts for difference inflate the cap." Under the current cap they cut £17. Allocation Round 7, whose results were announced on 14 January 2026, secured a record 8.4GW of offshore wind at a strike price of around £91/MWh in 2024 prices — well under what gas sets in tight hours (sources: UK government; Energy and Climate Intelligence Unit).
- "Suppliers are pocketing the difference." Profit is capped at 2.5% of bills, and the £46 rise in operating costs is thought to reflect household energy debt rather than margin.
- "A new North Sea field will bring prices down." The UK government's own line on the Jackdaw gas field is that it "would not…affect prices".
- "Household relief automatically helps factories." Industrial supply sits outside the Ofgem cap; it is set by procurement windows, network charges and levies recovered predominantly on the electricity line, which is why the fuel shock transmits to plants differently — and often with a lag.
6. Why the same number belongs in the plant, not only in the press
Manufacturers are watching a tougher scoreboard. The IEA's Electricity 2026 price analysis notes that electricity prices for energy-intensive industries stayed broadly stable across tracked regions in 2025, yet Britain's structural penalty persists: the Office for National Statistics has found that UK industrial electricity prices have ranged from 17% above to 49% above the IEA median over the past decade, and UK Steel's benchmarking puts British industrial electricity about 40% dearer than in France and Germany in 2025/26, adding roughly £41 million of cost to UK steel producers.
Policy is now aimed at precisely that gap. In the British Industrial Competitiveness Scheme — opened for consultation in November 2025 and taken forward during 2026 — the government says eligible manufacturers can see electricity costs cut by up to 25%, for more than 10,000 businesses, by lifting policy levies off bills rather than by touching the wholesale price. It is the clearest institutional confirmation available that the levy line was never the main driver; the main driver is the one Nesta quantified at nearly 90% of household electricity bill growth since 2020.
7. Case file: congestion is where the next network bill is decided
For engineers and site-energy managers, the most instructive figure in the analysis is the small £21 balancing line, because forward-looking evidence suggests it will not stay small. The National Audit Office's September 2026 examination of transmission upgrades warns that constraint costs could reach £6.6 billion to £7.8 billion in 2030 if grid reinforcement lags new generation, and that accelerating the three upgrades recommended by NESO would avoid roughly £4 billion of that. The independent review The grid we need now cites the system operator's estimate of £64 billion of transmission investment required by 2030 and a further £89 billion after it, against national demand growth of more than 30% by the mid-2030s from electrified transport, heat, industry and data centres.
Two operational consequences follow. Bottleneck geography becomes a siting variable: curtailment concentrates where generation and load are separated, which is why the locational or zonal pricing debate — pressed by suppliers such as Octopus Energy and by campaign group Britain Remade — is really a debate about where industrial load lands. And "available capacity" becomes a commercial term worth as much as unit price: connection offers, reinforcement dates and congestion forecasts belong in the payback model of any new line, furnace or charger bank.
8. Trend judgment: five signals between 28 October and January 2027
- Budget arithmetic. Media reports suggest that, at the budget on 28 October, the chancellor may take steps to help households and businesses cope with rising energy bills; expect re-weighting of levies between electricity, gas and general taxation rather than a wholesale-price fix.
- The next cap reset. Bills are expected to rise sharply under the January 2027 price cap, potentially by as much as a quarter. Cornwall Insight's modelling published in mid-October 2026 put the January cap near £1,999 for typical dual-fuel use, with the regulator's determination due in late November — a fixed calendar date for procurement teams.
- Gas curve persistence. Whether 220p per therm holds through winter drawdown decides how much of the £161 wholesale component unwinds; LNG cargo competition with Asia, not domestic fields, sets that.
- Decoupling rate. Electricity rose £180 while gas rose £368 in real terms since 2020 — the widening wedge is the evidence that renewables and CfD support are working, and it should keep widening as AR7 capacity lands.
- Network spend mix. With up to 80% of grid investment going to asset maintenance, the growth rate of the £417 (24%) network line says more about 2030 tariff design than any headline about green taxes does.
9. Action advice for operations, procurement and capital teams
- Decompose the invoice before negotiating. Rebuild it the way the cap is built — wholesale, network, operating, policy — and argue only the lines you can influence.
- Hedge in tranches, and check levy relief first. Fixed windows buy budget certainty but cap upside; scheme eligibility can be worth more than a few pence of negotiated unit price.
- Re-base load profiles against gas-set hours. Measure consumption by half-hourly settlement period; shifting batch ovens, charging and compressed-air duty out of cold evening peaks attacks the exposure directly.
- Treat curtailment risk as a design input. Ask the network operator about local congestion before committing to a plant expansion or a demand response contract.
- Pair electrification with contracted clean power. Heat pumps and e-boilers cut fuel exposure per unit of service delivered, but without a corporate PPA or CfD-adjacent supply they inherit the marginal-price problem.
- Model demand growth as a cost-spreading strategy. The "spread upgrade costs more widely" argument is not only a household policy point: a site that fills its capacity charge with useful load pays its network cost more efficiently.
- Ignore the culture war. Teams that plan on the assumption that net-zero levies are the enemy will hedge the wrong risk while the gas curve moves against them.
10. FAQ
Is net-zero to blame for British energy bills?
On the published arithmetic, no. Wholesale gas explains 90% of the electricity bill increase and 77% of the gas bill increase since 2020, while policy costs have fallen in both absolute and share terms, and CfDs are currently cutting £17.
Why does grid reform still matter if gas dominates?
Because it is the second-largest line in the cap at £417 (24%), it compounds, and constraint spending could scale to £6.6 billion–£7.8 billion by 2030 without faster reinforcement.
Should UK industry expect relief?
Partially and selectively: targeted schemes can remove up to 25% of an eligible manufacturer's electricity cost, but they do nothing about the £757 (44%) wholesale block, which stays hostage to the gas market.
What happens this winter?
A sharp rise is expected under the January 2027 price cap, potentially by as much as a quarter, with the level fixed weeks before it takes effect.
Does electrification help or hurt?
Both, in sequence. It breaks the direct link to imported gas and spreads network cost, as Sissons argues — but only if demand is flexed, contracted and sited with the grid's physical limits in mind.
Bottom line
The practical lesson for British industry is that the loudest argument about energy bills has been about the smallest number on the invoice, while the biggest one is set in a market no factory can influence. Volatility will therefore stay embedded in the cost base for as long as gas clears the margin. What a well-run industrial site can control is the composition of its own exposure: how much load sits inside gas-set hours, how much is contracted, how much flexibility is monetised, and how much network cost is spread across useful demand. Those four levers are where the next decade of competitiveness is actually won — not at the meter.
Sources consulted beyond the primary analysis: UK government (AR7 results; British Industrial Competitiveness Scheme), National Audit Office, NESO, IEA, Office for National Statistics, UK Steel, Energy Networks Association and Cornwall Insight. Corrections and data tips: news@industrialweekly.com (Industrial Weekly).