
FAQ: What China's Record 2026 Clean-Tech Export Wave Means for Plant Energy, Capex and Supply Risk
Chinese cargo ship. Credit: Cynthia Lee / Alamy Stock Photo
Operations, procurement and capital-projects teams rarely get a clean answer to the question that matters most right now: if a kilowatt-hour of Chinese-made solar, a battery rack or an electric truck is installed at a facility this year, what actually changes — in the carbon ledger, in the tariff stack and in the supplier landscape? A new Carbon Brief analysis puts hard numbers on that question, and the numbers are large enough to re-order several planning assumptions.
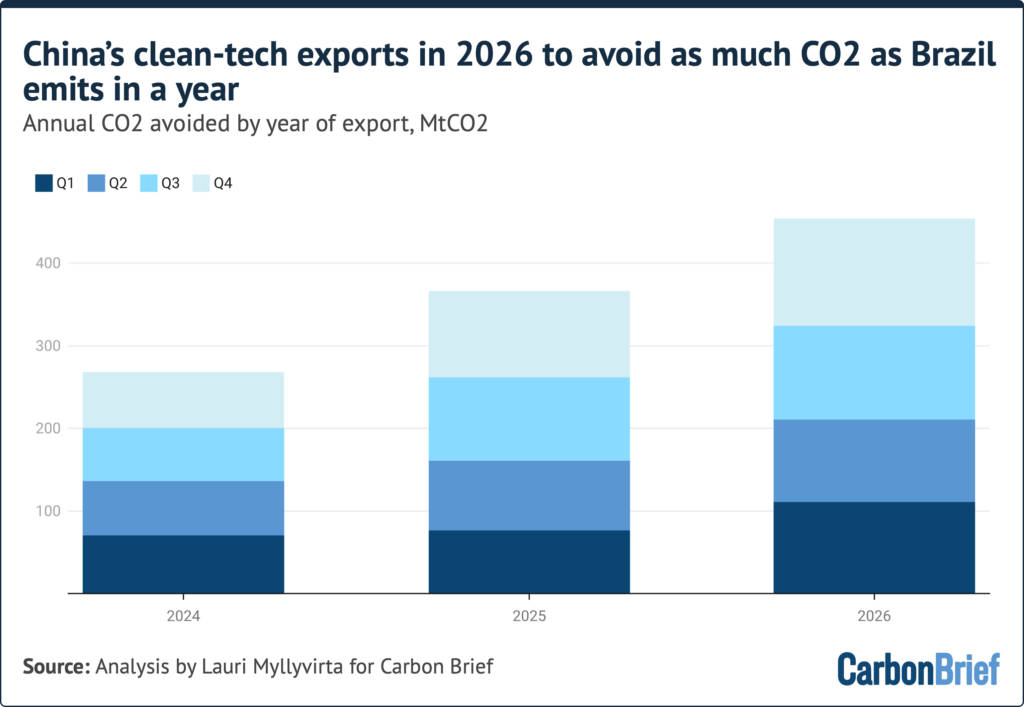
The core result: China's 2026 shipments of solar panels, wind turbines, batteries and electric vehicles are on course to trim emissions outside China by 2%, a saving often expressed as around 450m tonnes of CO2 per year — roughly Brazil's annual total. Below, we work through the analysis the way an industrial buyer would: question, short answer, then the decision implication for a plant, a fleet or a project pipeline.
The scoreboard: five numbers that reset your assumptions
| What you are planning for | Figure in the analysis | Operational read |
|---|---|---|
| Year-on-year momentum | Global CO2 impact of the exports rose 26% in the first three quarters of 2026, after 36% growth in 2025 | Deceleration in percentage terms, still a bigger absolute wave — volume planning should assume growth, not collapse |
| Product mix you can source | Electric car and heavy vehicle shipments up 61%; wind-turbines 45%; batteries 39%; solar 22%; electric two-wheelers 21% | The fastest-moving supply pressure is on the mobility side, not on modules |
| Lifetime carbon asset created in one year | 8,400MtCO2 avoided across equipment lifetimes, up a quarter from 6,800MtCO2 in 2025 and up two-thirds from 5,000MtCO2 in 2024 | Each year of installation locks in decades of abatement; delay is a carbon cost, not just a capex deferral |
| Where the abatement lands | 76% of lifetime avoided emissions in the global south, including 52% in south and south-east Asia, even though most export value went to the global north | Site energy strategy in Asia, Africa and Latin America is where imported hardware pays back fastest per unit |
| Manufacturing carbon debt | Full-year 2025: about 170MtCO2 emitted inside China to make the equipment, 370MtCO2 avoided abroad — a payback in roughly six months | Scope 2 and product-carbon-footprint arguments against imported hardware do not survive the arithmetic |
Q&A: the questions industrial readers ask first
Q1. Is the 2% emissions cut something that has already happened?
Short answer: no — it is a projection. The estimate of 450MtCO2 for the year is extrapolated from the year-on-year growth rate recorded across the first three quarters of 2026, on the assumption that the final quarter of 2026 holds the trend, and is set against emissions outside China taken from Energy Institute data. The model also nets out emissions generated by Chinese manufacturing, and weighs the power mix of each importing country.
Decision note: treat this as forward-looking avoided emissions from equipment put into service, not as verified reductions. Buyers writing decarbonisation targets should phrase them the same way their auditors do.
Q2. Solar or wind: which import carries the decarbonisation load?
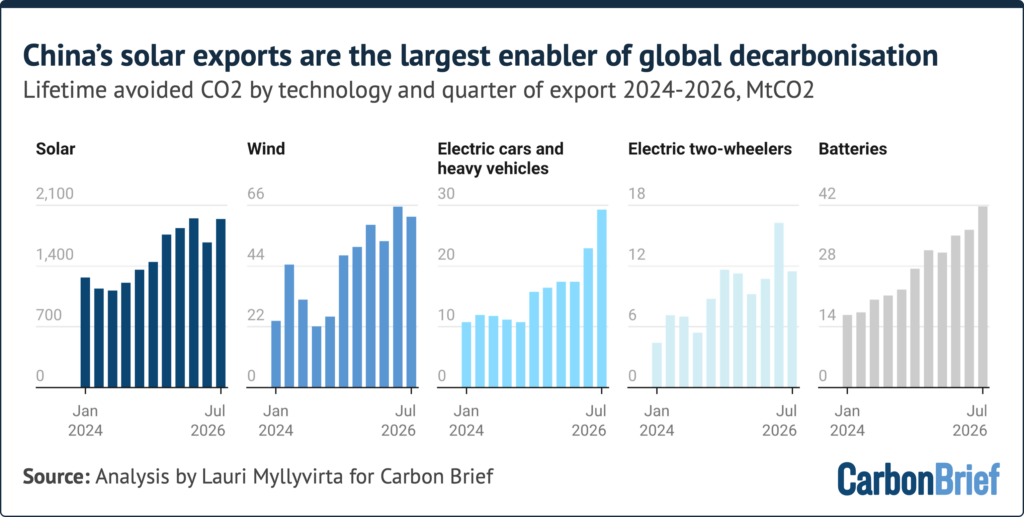
Short answer: solar, by a wide margin. Modules and intermediates shipped in 2025 correspond to 436 gigawatts (GW) of capacity once assembled and installed — quoted in gigawatts DC, i.e. panel capacity rather than the AC rating of the grid connection — alongside 8GW of wind-turbines. Together they generate about 720 terawatt-hours (TWh) of electricity a year; the 2026 wind and solar shipments are on track for roughly 800TWh, which is the annual output of around 100 coal-fired power plants.
Over asset lifetimes, solar equipment exported in 2025 avoids an estimated 6,400MtCO2, while wind-turbines come second at 180MtCO2.
Decision note: if a facility has roof, land or interconnection capacity, the marginal carbon return on a PV package is an order of magnitude above a wind package in most destinations. That asymmetry should show up in capital allocation, not just in sustainability messaging.
Q3. How do vehicles and storage fit into the picture?
China's 2025 clean-vehicle exports totalled 39m units, of which 36m were electric two-wheelers, plus 2.2m battery electric cars, 160,000 plug-in hybrid cars, 15,000 buses and 30,000 trucks. Batteries shipped the same year carried 305 gigawatt-hours (GWh) of capacity — enough, on typical pack sizes, to equip another 5m battery electric cars.
Running those vehicles against equivalent internal-combustion fleets and the grid carbon intensity of the importing country, EVs and batteries exported in 2025 avoid an estimated 170MtCO2 over their lifetimes. Because two-wheelers dominate the unit count, the real-world displacement question matters: e-bike studies support an assumption that roughly half of electric two-wheeler travel replaces car or motorbike trips, which puts those exports at about 40MtCO2 avoided. Lifetime assumptions behind all of this are 20 years for solar and wind, 10 years for cars and batteries, 5 years for two-wheelers.
Decision note: for logistics and plant-transport decarbonisation, the cheapest and fastest tonne of avoided CO2 is usually the light two-wheeler fleet — but it is also the least auditable, since displacement assumptions drive the result.
Q4. Where does the money go, and where does the carbon actually fall?
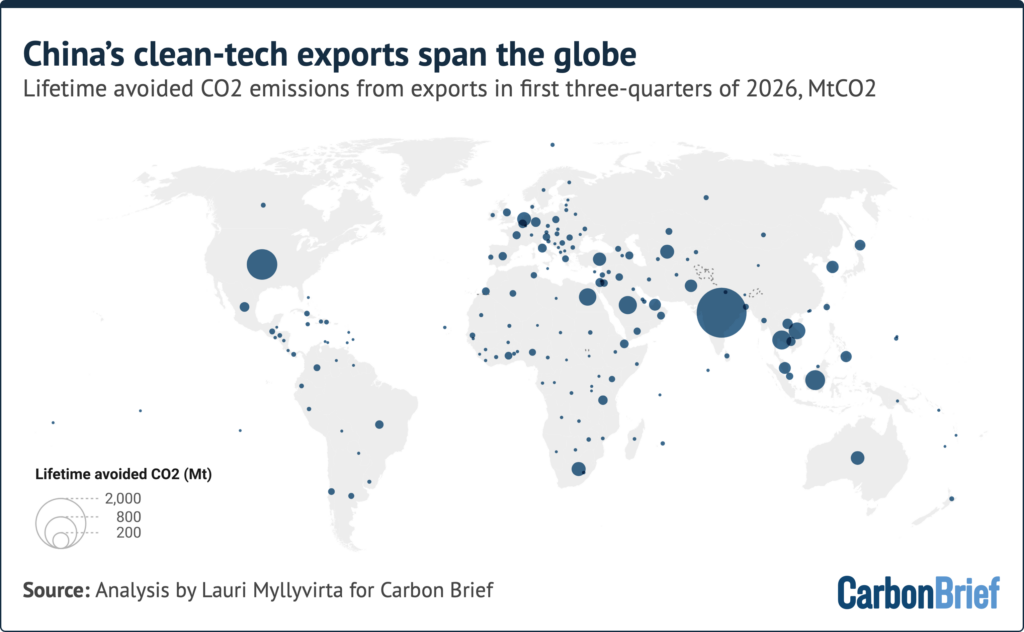
By value, most clean-tech exports in the first three quarters of 2026 still went to the global north. By avoided emissions, the picture inverts: 76% sits in the global south, of which 52% is in south and south-east Asia — a direct consequence of plugging Chinese modules into high-carbon grids. In 2025, global-south countries took 73% of lifetime avoided emissions and produced 87% of the year-on-year growth; so far in 2026 they account for almost all of the increase.
Earlier work for Carbon Brief put the 2024 effect at around 1% of emissions outside China, so the trajectory over three years is unmistakable: the avoided totals run into the billions of tonnes across every continent and nearly every country.
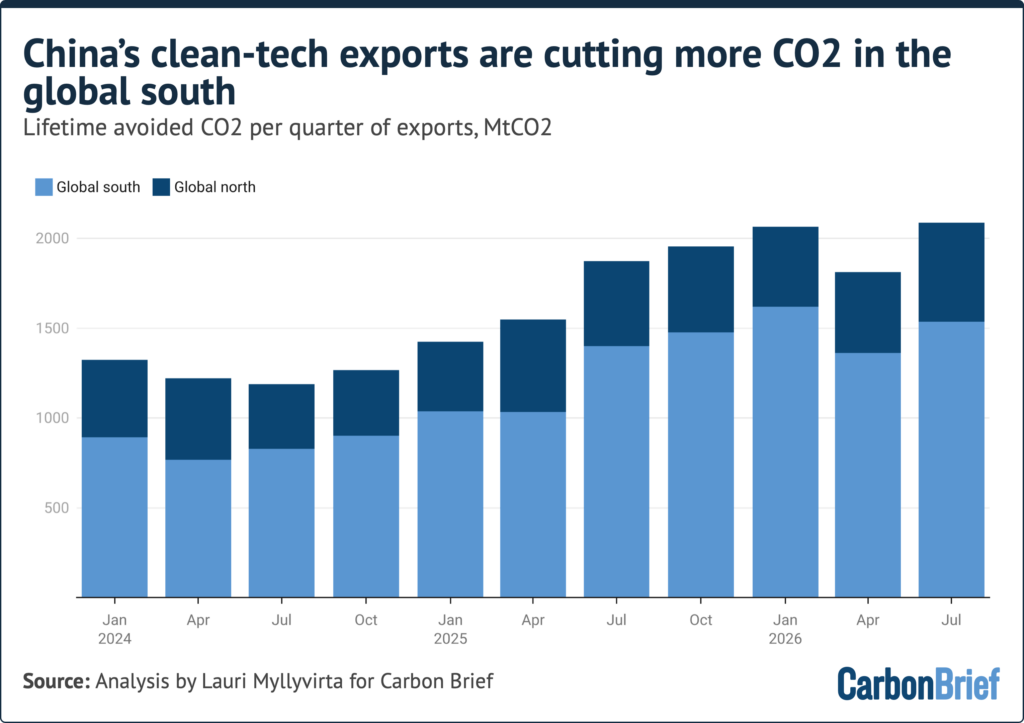
Regionally, South Asia leads on lifetime avoided emissions, with strong growth in 2025 and in the first three quarters of 2026. South-east Asia, North America, Europe and the Middle East follow.
Q5. Doesn't the tariff wall shut this out of the US market?
Short answer: it reshapes routing more than volumes. Adjusting for re-export — including post-tariff re-routing to the US via assembly or transit in third countries — Chinese solar equipment exports to the US rose 13% year-on-year across the first three quarters of 2026, recovering from the dip that followed the sharp tariff increase of June 2025. EV and battery shipments to the US added 3%. India remains the largest single-country beneficiary and the US ranks second, growing a further 12% in 2026 and now ahead of the EU as a bloc, followed by Thailand, Saudi Arabia, South Africa and Australia.
The EU buys more of every one of these technologies than the US does, yet the US avoids more CO2: better solar irradiation and a more carbon-intensive generation mix mean each gigawatt installed in the US displaces three-times more CO2 than the same gigawatt in the EU. The durability of those flows is itself the signal — demand held up despite the Trump administration's efforts to slow deployment and discourage imports.
Not every ranking moved upward. The steepest single change in country positions during 2026 was a fall in exports to the Gulf countries caught up in the regional war, a reminder that conflict-driven demand shocks can re-draw the map inside one budgeting cycle.
For regional comparisons, the analysis aggregates by UN subregions — including "western Asia", which covers Turkey, the Caucasus and the Middle East. One caution for anyone reading customs tables directly: transit and re-export hubs such as the Netherlands can look far larger than the true end market, which is why final-destination attribution matters.
Trade-measure context worth flagging for US-facing buyers: the US Department of Energy's overview of solar trade measures records Section 301 duties applied in stages to Chinese polysilicon, wafers and cells, and trade-analysis house SMM notes the Section 301 rate on solar cells has been lifted to 50%, on top of long-standing AD/CVD orders. That shipments still grew says more about demand elasticity than about tariff efficacy, and it suggests that any policy aim of cutting reliance on Chinese supply requires scaling domestic and third-country manufacturing first.
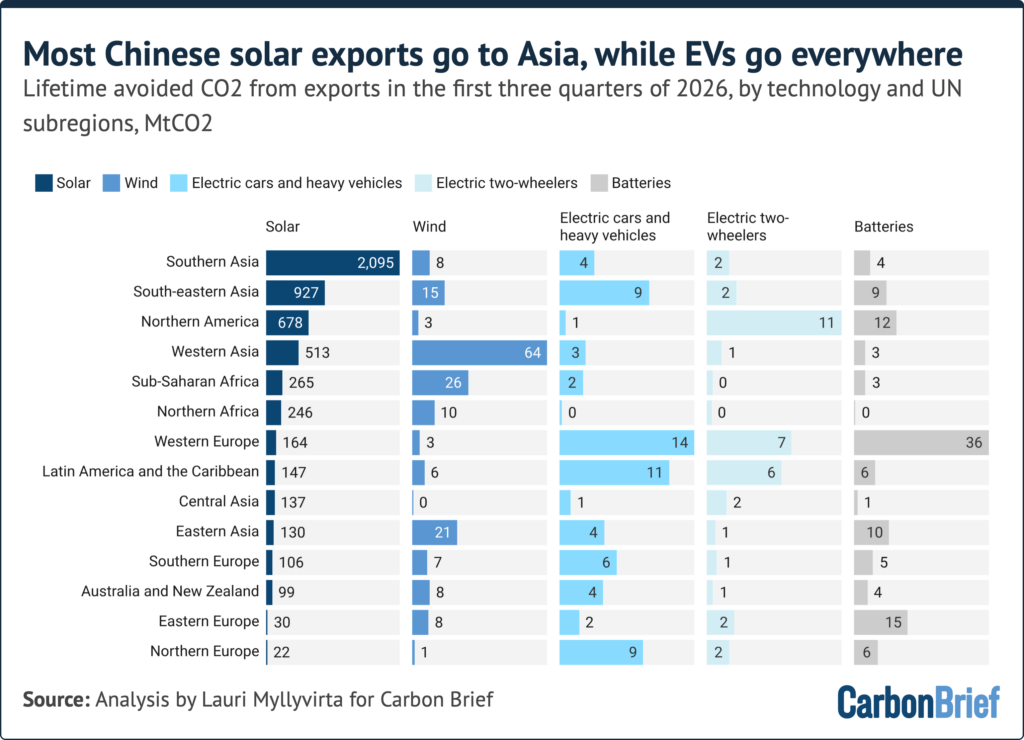
For electric cars and heavy vehicles, western Europe was the biggest destination in the first three quarters of 2026 — exports to the EU gained 39% — followed by Latin America and south-east Asia, both of which more than doubled as the oil crisis bit. Once batteries and electric two-wheelers are included, North America and Europe lead EV-related avoided emissions, ahead of Latin America and south-east Asia.
Q6. Are Chinese EPCs and project financiers taking the same ground that hardware exporters won?
Partly, but at a much smaller scale. The shift traces to the 2021 commitment by Chinese president Xi Jinping, who said:
"China will step up support for other developing countries in developing green and low-carbon energy, and will not build new coal-fired power projects abroad."
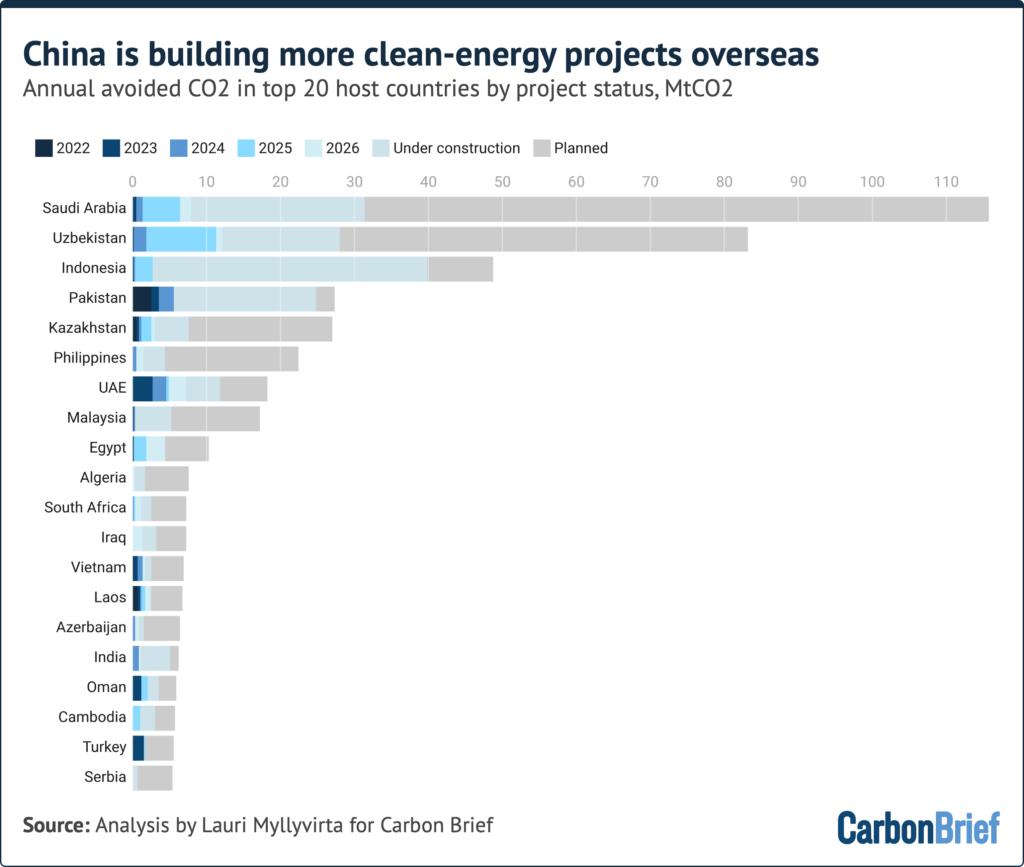
As of July 2026, roughly 69GW of China-linked renewable capacity was operating overseas, with 100GW under construction and 280GW in planning but not yet built. Storage attached to that portfolio stood at 3.5GW operating and 21.4GW in the pipeline. On the nuclear side, six China-financed and built reactors are operating, all in Pakistan, totalling 3.3GW with 26TWh of generation in 2023; construction on the 1.2GW Chashma-5 unit began in 2024, with commercial operation expected around 2030.
Expected output from newly operating China-linked clean-power projects doubled from 2022 to 2025, and rose a further 6% in the first seven months of 2026; the overseas project portfolio itself doubled over 2022-25. Indonesia, Vietnam, Bangladesh, Mongolia, Zimbabwe, Laos, Turkey and South Africa lead on estimated generation, while Saudi Arabia, Uzbekistan, Indonesia and Pakistan top the list for avoided CO2 once under-construction capacity is complete.
The scale check is important: in 2025, 8.4GW of Chinese-financed or China-involved solar projects entered operation and 18GW were newly announced — against 436GW of panels and intermediates exported that same year. Financing and construction are overwhelmingly done by local and other non-Chinese actors. Implementation gaps around the coal pledge — particularly "captive" coal plants attached to industrial projects in Indonesia — are the reputational risk to watch for partners who need to demonstrate that pledge.
Q7. Does the surge mean Chinese suppliers are crowding out everyone else?
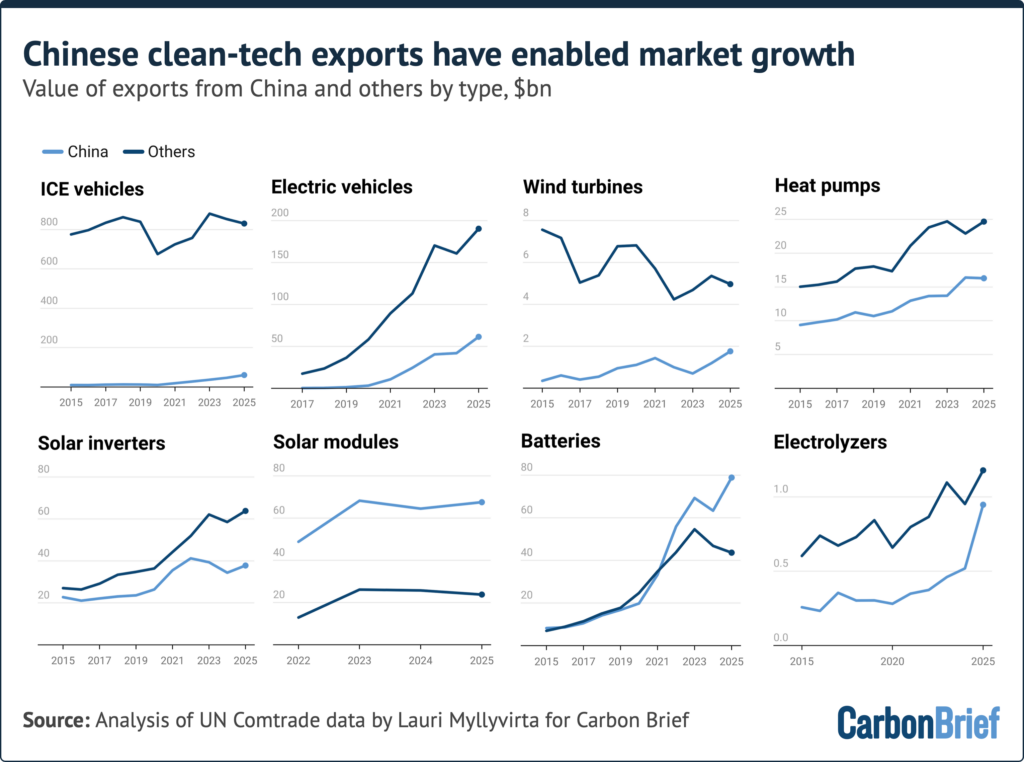
The fear usually gets framed as Chinese "overcapacity" squeezing domestic industry, from steel and chemicals to automotive. On this trade-flow evidence, mostly no: exports have generally been additional, capturing or enabling market growth rather than displacing rival shipments. Value of EV exports from other countries grew faster than China's, led by the EU27 — Germany in particular — plus Mexico, Japan, the UK and South Korea. Heat pumps, solar inverters and electrolysers grew for China and for everyone else.
There are exceptions in both directions. In wind, China's exports rose while other producers' volumes fell, which is displacement at the global level, though importing-country data shows Chinese turbines mostly headed to growing markets rather than taking share outright. Tariffs and restrictions on Chinese components have pushed other producers into existing markets for panels, inverters and heat pumps, with China's volumes redirecting to countries that barely imported solar before. Segment separation is real too: Chinese EV, inverter and heat-pump exports carry much lower unit prices than equivalent exports from other producers. The clearest displacement case is in fuel-burning vehicles, where low-cost Chinese product has replaced other suppliers.
Q8. Why does this matter to China's own industrial base — and to the electrification debate?
Clean-energy technology accounted for 16% of all net growth in China's total exports in the first half of 2026; that share slipped in the third quarter only because the broader export surge was so strong while cleantech growth also accelerated. Sector-wide, clean energy contributed a third of China's GDP growth in 2025, which gives Beijing a clear economic stake in the transition's success — and a reason to back the COP31 presidency's push for a global electrification target.
That push now has a concrete number attached: the COP31 "35-by-35" pledge, reported by Climate Home News, asks countries to lift electricity's share of global final energy consumption to 35% by 2035, from roughly 20% in 2023 according to the IEA's Electricity 2024 analysis. For industrial operators, that framing converts an emissions debate into a load-growth, interconnection and tariff-design debate.
Domestic balance still dominates the export story. Only 43% of solar cells and panels, 13% of EVs, 17% of batteries and 7% of wind turbines made in China were exported in 2025, so the home market is the real swing factor. EV and wind deployment there kept growing, but domestic solar and battery storage volumes fell off a record 2025. If that slowdown persists while exports keep expanding, overseas complaints about "unfair" trade practices are likely to sharpen — the pressure point for anyone assuming prices simply keep falling.
Case file: three situations to watch before you sign
- South Asia content rules. Because South Asia tops lifetime avoided emissions, sourcing plans there are exposed to local content policy: India's Approved List of Models and Manufacturers (ALMM) List-II mandate for domestically produced solar cells took effect on 1 June 2026, per trade reporting by Taiyang News, tightening what cell technology can be used in qualifying projects.
- Price-floor risk in the upstream. The assumption that imported hardware is a perpetual discount is weakening. Reuters reported in July 2025 that Chinese polysilicon producers were planning a 50 billion yuan (about $7 billion) fund to take out roughly a third of industry capacity under Beijing's "anti-involution" drive — supply discipline that transmits into module and cell pricing.
- Storage economics still moving. BloombergNEF's 2025 lithium-ion battery price survey, as summarised by Energy Storage News, put the all-sector pack average at $108/kWh (down 8%) and stationary-storage packs at $70/kWh, a 45% fall from 2024 — the reason more plant owners are now pairing rooftop PV with batteries rather than sizing for self-consumption alone.
Common misconceptions to drop
- "The 2% figure is a reduction already in the atmosphere." It is avoided emissions from equipment being deployed, not a completed cut.
- "Manufacturing emissions abroad cancel the benefit." On 2025 full-year data, 170MtCO2 of Chinese manufacturing emissions were offset by 370MtCO2 avoided elsewhere — a payback in about six months.
- "Export growth means other manufacturers lost volume." Additionality holds in most categories; wind is the main global-level exception and fuel-burning vehicles the clearest displacement case.
- "Tariffs equal market closure." US-facing solar volumes still rose 13% once re-routing is counted, and US avoided emissions rose a further 12%.
- "Project finance is the main channel of influence." Hardware exports dwarf overseas project building by a wide margin.
Action list: six checks for procurement and capital teams
- Re-baseline your site's avoided-emission estimate on the destination grid, not a global average — irradiation and carbon intensity swing results by multiples.
- Split quotes by DC versus AC rating when comparing module packages; capacity claims that mix the two are not like-for-like.
- Price a 20-year asset and a 10-year asset separately. Solar and wind, vehicles and packs, and two-wheelers at 5 years all belong in different capital cycles.
- Stress-test landed cost on the assumption that upstream price discipline and domestic-content rules can end the discount run.
- Document origin and routing. Where re-export and third-country assembly are involved, expect customs data and carbon claims to diverge.
- Tie mobility electrification to a verifiable displacement assumption before booking the saving; light vehicles are where claims are weakest.
Rapid answers
Which year of exports avoids the most?
2026, at a lifetime 8,400MtCO2 — a quarter above 2025 and two-thirds above 2024.
Biggest single enabling product?
Solar equipment; wind-turbines are a distant second.
Biggest risk to the export trend?
A sustained Chinese domestic solar slowdown, which would tilt more capacity into export markets and intensify trade friction.
How the numbers were built
The analysis treats each exported unit of generating capacity as displacing electricity from its destination-country grid, and each exported electric vehicle as displacing fuel in an equivalent internal-combustion vehicle. Solar volumes cover finished modules plus intermediates (wafers and cells), expressed as finished-panel-equivalent gigawatts using Ember's China solar exports tracker; wind and battery totals come from the China Wind Energy Association (CWEA) and the China Automotive Battery Innovation Alliance (CABIA), allocated to countries and months by customs-value shares; vehicle counts come from China Customs, with exports to Hong Kong excluded and replaced by Hong Kong's onward re-exports. Project data draws on DCore, nuclear data on the World Nuclear Association, and grid carbon intensity on Ember.
For an industrial audience, the takeaway is neither triumphalist nor defensive. It is a procurement reality: the hardware needed to electrify plants, fleets and project pipelines is being shipped in volumes that reshape carbon accounting country by country, and the smartest move in 2027 planning is to convert that availability into locked-in capacity before tariffs, content rules and upstream price discipline price the option away.