
AI Build-Out Rewrites the 2026 Production Ledger: Triple-Digit Output in Taiwan, a Memory-Cost Shock and the Industrial Response
Two instruments are moving in opposite directions, and the same managers are reading both. The Semiconductor Intelligence analysis published on 22 October records accelerating electronics factory growth across the major producing economies, with the artificial-intelligence infrastructure build-out doing most of the pulling. Layered on top of that expansion sits a supply and price shock in memory that is shrinking PC and smartphone volumes and forcing device makers to revisit production plans. Taken together, the pair describes a re-allocation of capacity and component budgets — a scheduling, sourcing and capital-review problem, not simply a favourable trade statistic.
How the Numbers Are Built, and What That Means for Reading Them
The measurement convention matters as much as the percentages. Semiconductor Intelligence expresses production as a three-month average change against the equivalent window a year earlier. Month-to-month plant noise — shift changes, inventory correction, planned shutdowns — is smoothed out, and every value in the series is already a year-on-year statement rather than a snapshot of one month.
For an industrial reader that convention carries two consequences. First, an extreme reading in a single country points to a structural shift in committed capacity rather than a one-off order spike. Second, direction of travel is more informative than the precise decimal: the same series can cross from contraction to double-digit expansion inside one calendar year, which is exactly what happened in Japan and the EU27 during 2026.
Case in Point: How AI Modules Made Taiwan the Fastest Line in the Series
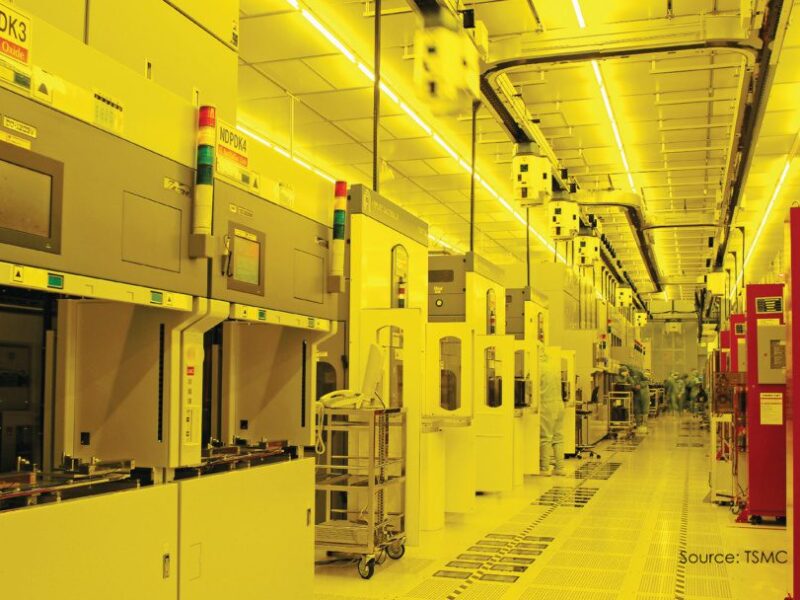
The most extreme data point sits in Taiwan, where electronics output rose by more than 100% year-on-year during much of 2026 on the three-month average basis. The consultancy attributes most of that increase to AI modules built around NVIDIA hardware: TSMC manufactures the integrated circuits, while other Taiwanese companies assemble those components into finished modules.
What makes this usable as a case rather than a curiosity is the chain structure. A single demand stream — AI infrastructure — pulls several tiers of capacity in sequence, from circuit fabrication through module assembly to board-level integration for data-centre customers. Because those tiers sit inside one regional ecosystem, a platform-level commitment registers as output growth across multiple companies at once. Buyers sourcing anywhere near advanced logic, DRAM or flash should read Taiwan's growth rate as a gauge of how much capacity has been pledged to that one stream.
Turning Points in Japan, EU27 and the US
Elsewhere, the story of 2026 is a change of sign rather than a change of scale. On the same measure:
- Japan moved from a 1.5% year-on-year contraction in January to 17.6% growth in August.
- For the EU27, production swung from a 10.5% decline in January to 16.9% growth in July.
- In the US, electronics output rose 8.1% in August, extending an acceleration that began in October 2025.
The spread is instructive. The EU27 reached double-digit territory on a mid-year reading, Japan followed shortly after, and the US has been rebuilding momentum for more than a year. A demand assumption that looked prudent when a 2026 budget was set had visibly aged by the middle of that same year.
Asia's Wider Board: A Dispersion of National Rates
Other Asian manufacturing economies posted substantial increases as well, at very different scales.
| Manufacturing economy | Year-on-year production growth | Reference month |
|---|---|---|
| Thailand | 71% | August |
| Vietnam | 40% | August |
| Malaysia | 22% | August |
| South Korea | 18% | August |
| China | 17% | August |
| India | 14% | July |
These national growth rates should not be confused with an overall global growth estimate: each describes an individual production base with its own export mix and customer set.
The Cost Side: Memory Inflation Against Falling Device Shipments
The manufacturing strength is not evenly distributed, and the reason is visible in the component market. Citing IDC data, Semiconductor Intelligence records worldwide PC shipments down about 20% year-on-year in the third quarter of 2026 and smartphone shipments down 22%. Over the year to the third quarter, memory costs rose 350%, reflecting heavy demand for DRAM and flash memory from AI infrastructure.
| Indicator | Direction | Magnitude | Reference window |
|---|---|---|---|
| Worldwide PC shipments | Down | about 20% year-on-year | third quarter of 2026 |
| Worldwide smartphone shipments | Down | 22% | third quarter of 2026 |
| Memory cost | Up | 350% | year to the third quarter |
| PC shipments, full-year forecast | Down | 11.3% | 2026 |
| Smartphone shipments, full-year forecast | Down | 13.9% | 2026 |
The forward view points the same way: IDC forecasts an 11.3% contraction in PC shipments for 2026, and Semiconductor Intelligence also cites a 13.9% expected fall in smartphone shipments. As eeNews Europe previously reported on rising mobile DRAM prices, higher component costs have forced handset manufacturers to reconsider production plans, particularly for lower-priced devices.
The Wider Production Outlook and Why It Looks Different
Atradius projected worldwide output growth of 11% in 2026 and 7.3% in 2027 in its August electronics and ICT industry outlook. That global forecast covers a broader industry measure than the national production series analysed by Semiconductor Intelligence, which is why the two do not have to agree — and why an internal plan anchored on one will never reconcile with a plan anchored on the other.
Four Ways This Data Gets Misread
- Rolling national percentages into a single global growth story, when the series explicitly warns against confusing national rates with an overall global estimate.
- Treating "electronics" as one market, when AI-linked output and consumer-device output are moving in opposite directions in the same quarter.
- Reading output expansion as evidence that device demand has recovered, while shipment volumes are still forecast to contract.
- Comparing successive three-month average readings as if they were monthly prints, which overstates the apparent volatility of any single plant.
Action List for Production, Procurement and Capital Review
- Re-baseline memory-sensitive cost assumptions against the year to the third quarter, when a 350% increase was recorded, rather than against the pre-surge price deck still embedded in many annual budgets.
- Split the portfolio by demand stream: products feeding AI infrastructure, including NVIDIA module chains and TSMC-fabricated circuits, versus memory-heavy consumer devices facing forecast declines of 11.3% and 13.9%.
- Put the sign of the three-month average — not just its level — on the quarterly review agenda for each sourcing region, given the January-to-August swings in Japan, the EU27 and the US.
- Use the Asian dispersion across Thailand, Vietnam, Malaysia, South Korea, China and India as a capacity map for siting and volume decisions, and validate those decisions against the relevant national series rather than the global 11% figure.
- Keep PC- and handset-linked component commitments under formal review while memory pricing holds, since manufacturers are already reconsidering production plans for lower-priced devices.
- When the numbers go to the board, label the source and the measure: Semiconductor Intelligence for national production, IDC for shipment volumes, Atradius for the worldwide outlook through 2027.
FAQ
Which economy grew fastest in electronics production during 2026?
Taiwan, with output up more than 100% year-on-year on the three-month average measure during much of 2026, ahead of Thailand at 71% in August.
Why is factory output rising while PC and smartphone shipments fall?
Because the same AI infrastructure demand that lifts module output also absorbs DRAM and flash, pushing memory costs up 350% over the year to the third quarter and squeezing device makers.
How should the Atradius 11% forecast be reconciled with the national figures?
It should not be averaged with them. The Atradius number projects worldwide output growth of 11% in 2026 and 7.3% in 2027 on a broader industry measure, while Semiconductor Intelligence tracks national production series.
What does the three-month average method remove?
It smooths monthly fluctuation by comparing each window with the same period a year earlier, so short-term inventory or shift effects do not drive the reading.
What is the practical takeaway for an operations leader?
Separate capacity signals tied to AI infrastructure from cost and volume pressure on consumer devices, and let each drive its own planning assumption instead of one blended "electronics" number.
Read as a whole, the 2026 figures are less a boom headline than a re-allocation signal: capacity, capital and component budgets are being drawn toward AI infrastructure, and the industries competing for what remains are precisely the ones showing up as shipment declines. The discipline that follows is straightforward — name the layer behind every assumption, whether a national production series, a global industry outlook or a component price index — because that separation is what converts a table of country growth rates into a usable input for plant scheduling, sourcing strategy and investment review.